How many children start school with a language disorder?

Logo

Six years ago now I got a generous grant from the Wellcome Trust to start the SCALES project. I have been guided and supported by a dream team of collaborators: Gillian Baird, Tony Charman, Andrew Pickles and Emily Simonoff who have ensured I didn’t make too many stupid mistakes and from whom I’ve learned an enormous amount. I’ve also had the good fortune to work with very talented and extremely hard-working research staff and PhD students, especially Dr Debbie Gooch, who is a master of organisation and a whiz at Stata!

Today sees the publication of the first major paper from the in-depth assessment of children participating in SCALES. I hope that it is a paper that will have lasting impact. I hope it will raise awareness of language disorder and the consequences of poor language development for classroom success. I hope it will encourage those shaping education policy to realise the value of focusing on oral language development in the early years curriculum. And I hope it will challenge the speech-language therapy profession to rethink systems of prioritisation to provide an equitable service to all children with language learning needs.

So what did do and why did we do it?

One of the main goals was to figure out how many children in England start school with a language impairment (this is called prevalence), and demonstrate how that impacts their school lives. This sounds fairly straightforward but it isn’t! Language is multi-faceted: we measured vocabulary, grammar and narrative skills across two modalities, speaking and understanding. This is the combination of tests that has informed current diagnostic criteria for language disorder in the diagnostic manual most commonly used in North America (the DSM5).

The next question is ‘how low should we go?’ Different studies have used different cut-offs for language impairment – our paper shows that this can drastically affect prevalence estimates. Our study used a more severe cut-off than has been used previously of -1.5SD below (~7th centile) the population average on 2/5 language tests.

The other criteria we looked at was non-verbal ability. For many, many years researchers and clinicians have focused on ‘specific’ language impairment: language deficits that occur in the context of otherwise normal development. Thus children are diagnosed when language is poor but non-verbal IQ scores are within the normal range, and no other developmental conditions (such as autism or Down syndrome) are present.

However, in recent years we have learned so much more about the developing brain and genetic influences that affect language development and these lines of evidence really make us question the validity of a ‘specific’ language impairment. So much so that DSM5 removed NVIQ requirements.  So we included in our language disorder group children with non-verbal IQ scores between 70 and 85, as well as those with non-verbal IQ scores within the ‘normal’ range.

Finally, we wanted to demonstrate the functional impact of language disorder. To do this, we took advantage of the fact that all children in England are assessed on the Early Years Foundation Stage Profile at the end of their first year in school. To achieve a ‘good level of development’ children must meet or exceed 12 key curriculum targets, which cover speaking, listening, reading, writing, numeracy, physical and social development.

So what did we find out?

  • A shocking 1% of children were reported by teachers to have “no phrase speech” at the end of their reception year!
  • 4.8% had language impairment and non-verbal abilities within the normal range
  • 2.78% had language impairment and non-verbal IQ in the 70-85 bracket. So including them increases the prevalence estimate by ~50% to an overall estimate of 7.58% of children starting school with a (currently) unexplained language disorder. That’s two children in every Year 1 classroom!!
  • An additional 2.34% met the same criteria for language disorder, but in the context of intellectual disability and/or a known medical condition (such as autism).
  • Children meeting criteria were very unlikely to meet education targets on the Early Years Foundation Stage Profile – only 11% of them did so.
  • Having non-verbal IQ scores in the 70-85 bracket did not yield a wildly different clinical profile. Compared to children with non-verbal IQ within the normal range, these children did not have more severe language impairments, they did not have a qualitatively different pattern of language impairment, they did not have more pervasive behaviour problems and they didn’t even have worse outcomes on the EYFSP.
  • Fewer than half of the children who met criteria for language disorder had been referred to speech-language therapy services.

What did we conclude?

I think our findings emphasize the importance of oral language for children starting school. Many teachers have said to me that in order to focus on it, oral language needs to have the same status and protected teaching time that literacy and numeracy do. Of course there will still be some children who require specialist support, and our findings clearly indicate this support should not depend on non-verbal IQ.

The reason we highlight this is because non-verbal IQ is the most common criterion used to exclude children from specialist clinical services, like language units or speech-language therapy. To me this doesn’t make much sense – these children still have language learning needs! Some people have suggested to me that children with lower non-verbal IQ may not respond to intervention in the same way. We don’t really have the evidence to support that claim, in part because these children are often excluded from intervention trials. But even if that were the case, that shouldn’t mean no service, it just means we need to establish what the most appropriate interventions are for children with multiple developmental challenges.

And just so you know, to get to this publication we:

  • Distributed more than 10,000 information sheets and consent forms
  • Screened over 7,200 children who started a reception class in Surrey in 2011
  • Visited 195 schools all over Surrey and some schools further afield, such as the Isle of Wight and Devon! We could not have done this study without their amazing support (and the cups of tea they provided) – thank you!!
  • Assessed 600 children in Year 1 and 94% of them again in Year 3
  • Our testing team has spent over 2624 hours assessing the children – and probably at least that long again driving to schools – Surrey is a huge county!
  • Parents and teachers have completed and returned ~4000 questionnaires – our response rate from teachers in Year 3 was 70% – amazing!
  • And: I moved house, I moved to a new job, Debbie had two babies (!), one PhD student graduated and two more are due to finish this year.

So I think I’ll take a few hours off now before I get back to writing more SCALES papers…

The paper is Open Access and can be freely downloaded from this site:

http://onlinelibrary.wiley.com/doi/10.1111/jcpp.12573/abstract

Mind the gap!

firstdayschool 007

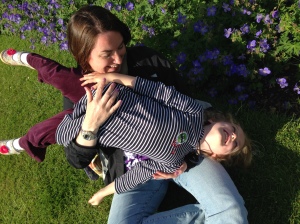
This photo was taken on my daughter’s first day of school. She is bursting with pride and excitement– she just couldn’t wait to get to big school! She has also just turned four. She looks so small to me now- her book bag is almost as big as she is!

Although I’d heard that summer born children struggled at school, I was not remotely worried about her. She is incredibly social and was a seasoned nursery attender – she knew the drill. You may also not be surprised to hear that as the daughter of two academics (one of whom is also a speech-language therapist) she is pretty verbal. This is a child who at the age of two could use a word like ‘cacophony’ in a contextually appropriate way, having inferred the meaning from repeated readings of Hairy McLary.

And things started off well. Her first teacher was Miss Honey (I know – you couldn’t make it up!) and she went to an excellent school in Oxford in which the three form entry was organised by season of birth. All of the children in her class were born between May and August – a nightmare for birthday party season, but it meant she was with similarly young, small children. By Christmas they were going to different classes for various lessons, but because everyone in the class was doing the same thing, the kids had no idea that they were being ‘set’.

In the New Year we moved to London and she became one of the youngest in the class. Her glowing report from Oxford meant she was put on the ‘top’ table. However, it was soon clear that she could not write as well as her older peers. When I went for parents evening, I was shown the evidence. She had been asked to make a sequence of four pictures from seed to flower and write four sentences describing how a plant grows. At 4 ½ years of age! I could see the panic on the page – letters rubbed out and crossed through, a few stabs at complete words, but with backward letters of different sizes and it was difficult to make out what she was trying to say. She’d been moved from the ‘top’ table and she absolutely understood that she was being demoted. By the end of the year, my bright enthusiastic girl was saying ‘I don’t like reading’ and ‘Mummy, I just can’t do writing.’ The teacher queried whether my daughter had some learning problems, but then conceded ‘we don’t actually know what she is capable of because she won’t try things.’ No wonder!

Of course this is just one story, but it helped me to understand some findings from the first phase of the SCALES project, which have been published today in the Journal of Child Psychology and Psychiatry. We asked teachers to rate children’s language skills at the end of the Reception year. We took at cut at the bottom 10th centile, figuring that this would help us identify children at higher risk of having a language impairment. The problem was that 47% of children in the ‘high risk’ group were  born between May and August – if age group had no impact we’d expect 33% from the summer months. Summer born children were also more likely to have reported behaviour difficulties and were less likely to achieve a ‘Good Level of Development’ on the Early Years Foundation Stage Profile. To achieve a Good Level of Development, children need to meet or exceed all 12 targets in prime areas of personal, social and emotional development; physical development; and communication and language) and in the specific areas of mathematics and literacy. Take a look – these targets are pretty challenging for four year olds.

Indeed, across the population of more than 7000 children, only 57% achieved a Good Level of Development. I thought we must have made a mistake, but in fact the Government’s own report indicates that nationally, only 52% of children meet these targets. For children scoring in the bottom 10% of our language measure, fewer than 5% achieve these targets. Although age is a significant predictor of academic attainment, teacher ratings of children’s language skills were by far the strongest predicator of school success. What this suggests to me is that (a) the curriculum targets are developmentally inappropriate and (b) younger children in particular do not have sufficient oral language skills at school entry to meet curriculum demands.

The question then becomes ‘what should we do about it?’ In the paper we discuss different strategies, for example holding summer children back a year, raising the age of school entry for everyone, or adjusting measures like the Early Years Foundation Stage Profile to take account of age.  The first two have major cost implications – our nursery bill was more than the mortgage – so until we sort out affordable childcare, sending children to school at the age of four remains a necessity. Adjusting measures for age could help prevent the over-identification of younger children as having special educational needs, but it wouldn’t necessarily prevent the classroom practices my daughter experienced that exacerbate age-related disadvantages.

Instead, in the paper we suggest that the age at which children go to school doesn’t matter so much, as long as what we are asking them to do is within developmental reach. To this end, I think it would be beneficial to focus the reception year curriculum on developing oral language skills as a good foundation for learning, literacy and social development. A four year old should absolutely be able to tell you how a seed becomes a flower, but there is no need to be able to write about it!

Are all summer born children doomed by the education system? Of course not. The effect is small and many young children will catch up. But other studies have shown lingering effects of being the youngest at school entry, both in actual attainment and in the child’s own perceptions of their learning potential. My daughter is now in Year 2, loves school and is doing extremely well. But she is still reluctant to try something new just in case she won’t be able to master it immediately (a real problem for learning how to ride a bike). Her confidence has been knocked and she is cautious.

I gave a talk in Sweden awhile back (they of course think we are bonkers for sending our children to school at such a young age) and was asked to describe the perfect classroom. I don’t think I gave a good answer then, but now I know. At least in reception, school should be the most exciting place a child could be and a place where they repeatedly experience success. A curriculum that focuses on developing oral language and using language for learning, for social interaction and for regulating behaviour is one that will benefit all children in their first year of school, whatever their age.

Norbury, CF., Gooch, D., Baird, G., Charman, T., Simonoff, E. and Pickles, A. (2015). Younger children experience lower levels of language competence and academic progress in the first year of school: evidence from a population study. Journal of Child Psychology and Psychiatryhttp://onlinelibrary.wiley.com/enhanced/doi/10.1111/jcpp.12431/

Work Hard Play Hard

iphoneJuly2014 114

Earlier in the academic year I was asked to give a seminar to our graduate students and early career staff on the topic of ‘work-life balance.’ When I told my lab this, they all laughed, confirming my own mystification as to why I was chosen to do this.

Having been asked to speak on this subject though has made me think very hard. What does work-life balance actually mean? Do I actually have good balance in my own life? And can I impart anything useful to junior colleagues?

After pondering this topic for a considerable time, I came to a few conclusions. First, I decided the title was all wrong. When I think about my career, balance is not the image that comes to mind, it’s much more like a rollercoaster. There are periods of relative calm and balance, but these are punctuated by exhilarating highs and sometimes punishing lows.

The other thing I realised is that work-life balance is not something I have, but is something that I am pretty much always working on. Sometimes I feel pretty sorted, other times far less so. And what I consider balance may be quite different to what others can live with. Each person needs to find their own path.

Finally, I thought perhaps the most important message to get across was that getting work-life balance is all about choice and compromise. I’ve learned that it really is impossible to ‘have it all’ but entirely possible to have a good compromise that results in a satisfying career and a happy home life.

How best to convey this? Well, as the seminar was aimed at students and early career folk I tried to remember what I most wanted to know back then. And what I wanted to know was how do successful people manage things? How hard are they really working? Do they ever have any fun? So what I did was put together a short story of how I got to where I am now, from my early days as a carefree speech-language therapist to my current role as Professor running a big research programme, teaching and enjoying motherhood. My lovely husband Ray has been with me for that entire journey and has been hugely supportive of my career. If there is any balance it is largely thanks to him.

A few caveats –my PhD student Charlotte thought it would make things more entertaining to include photos of myself at different stages of my career. There is far too much text on the slides but hopefully this means other people will be able to follow it. And the thought bubbles around Dorothy Bishop’s head are my thoughts, not hers. I thank her as always for teaching me so many useful things (including how to punt) and for continuing to be a great mentor.

In the end, not many people came to the seminar – they were all too busy working! But I thought I would post the slides, in case anyone does find it useful. I also thought posting this would be a good opportunity to ask other people how they juggle work and home, and what are your (loose) rules for maintaining a healthy perspective? Answers on a postcard please (or leave a comment below).

Seminar: work-life balance

Decisions, decisions

Stage 2 is now well under way, in the first month of testing we’ve got complete datasets on about 50 children (or 10% of our target sample). Once again, schools in Surrey are demonstrating just how fabulous they are. They are doing a stellar job of getting consent forms returned from families and have welcomed us with open arms. Some have even asked if we’ll be doing the screening programme again this summer, though I do pick up a sense of relief when I tell them that is most definitely not on the cards!

One thing teachers have been asking me is how we’ve selected the cohort for detailed assessment from the initial pool of 7532. This is an excellent question and one that occupied quite a bit of head space this summer. It also generated huge debate amongst the SCALES team, so I thought I’d share a little bit about the process.

The first decision we needed to make was whether we would exclude any cases before we selected the main cohort. Here we ran into some competing aims of the project. In the first instance, we want to have a truly representative picture of the population of children starting school. In that case, we don’t want to exclude anyone. However, the longer term aim is to follow up children with primary language impairments. In that case, it could be difficult to interpret findings if our ‘high-risk’ group to consist primarily of children with existing diagnoses of other developmental disorders, or significant sensory impairments, or those who speak English as an additional language (EAL). (You may be interested to here that ~800 children in our sample were reported to speak additional languages). We also have a very practical consideration – the children need to be able to take part in our further assessments, otherwise we are wasting everyone’s time.

In the end, we made two exclusions. We separated children with EAL from the main cohort so that we could sample them separately. We are seeing a proportion of these children now, but are also applying for some additional funding to see more of them at a later date. The second decision was a little more difficult. To our astonishment, 1% of the sample were reported to have ‘no phrase speech’ at the end of their first year in school, and half of them were in mainstream classes! As this yielded the maximum score on the screen, quite a number of these children could have been in the final cohort. We want to know about them in lots of detail, but decided to see them all as a separate group, rather than just see a proportion of them in the final cohort (this will be yet more work for us, but is also completely fascinating to me).

The next thing to do when you have lots of data is to make a graph of it. This is a really useful way of spotting obvious errors in the dataset. You really hope you don’t end up with a distribution that looks like this, because it suggests something strange is going on. Instead, one hopes for a normal distribution (remember our bell shaped curve?) or perhaps one that is slightly skewed, assuming that most of the children we screen will have no difficulties whatsoever.

Now the next decision we need to make is where to draw the cut that will define the ‘high-risk’ group. This is a pretty arbitrary decision and a tricky one – make the cut too generous (say bottom 15%, or one standard deviation below the mean) and you are more likely to identify children with mild or transient difficulties. Make the cut too severe, and you are likely to end up with children who do have persistent language impairments, but also probably have more complex difficulties and global developmental delays.

We began by taking a cut at about 12%; now obviously for a screen it is simpler if you can just use a single cut-off score but it was quickly obvious that this was going to be problematic for us. For a start, there were big gender differences – twice as many boys were identified as being at-risk than girls (though interestingly when we applied that cut-off score to the EAL children there were no gender differences). The next shocker was that almost half of the children in the high risk group were summer born. We’d jokingly talked before about the ‘summer born boy’ phenomena, but there it was and we couldn’t ignore it.

So basically we had to create six mini-populations taking account of gender and season of birth. Then we looked at the distribution of scores within each of those six cells and used a cut-off score that would identify 14% of each of those groups as being ‘high-risk’.

We also had to make a decision about gender ratios in the final cohort. Like most developmental disorders, boys outnumber girls in clinical samples. And as I mentioned, this seemed to be the case in our sample as well (though interestingly, in the Iowa population study, boys only marginally outnumbered girls in the high-risk sample). So we could maintain those gender ratios in our final sample, but there is very little research on girls with language impairments or how gender affects clinical presentation of language impairment. So we decided to over-sample girls. This simply means that we elected to have equal numbers of boys and girls in our sample,regardless of what the proportion of boys is in the final high-risk sample. When we do our analyses, it is possible to ‘weight’ cases so that the results yield a truer estimate of what would be expected in the population. The advantage of doing it our way is that we should have sufficient numbers of both genders to say something sensible about possible sex differences.

We then had a few discussions about socio-economic status (SES). There is some evidence that children from more deprived backgrounds are more likely to have difficulties with language and communication. It is therefore possible that our two risk groups might differ significantly on SES; we could try to ensure that this didn’t happen by matching groups on an SES variable. However, if SES is reliably associated with risk status, then matching for SES might eliminate some important differences that are worth exploring in more detail. We therefore decided not to adjust for SES but rather to see where the cases fell. We do have SES information on everyone, but have not looked at it yet in any detail.

To get the final numbers, we also had to guesstimate what our response rate might be. We want to assess 500 children – 300 high risk and 200 low risk, but we know that not everyone we invite will take part. Some families will have moved, some will not want to be involved and still others will just not return consent forms (I too am terribly remiss at looking in by daughter’s book bag and sending slips back to school!). So we need to invite more people than we want to see. On the other hand, when parents agree to take part they have a reasonable expectation that we will then see their child. And given the level of co-operation and enthusiasm that exists in Surrey, we were fairly confident that schools would be pro-active in ensuring parents got the information and followed up on it (we were right about that!).  So we decided to invite just over 600 children in the hopes that 500 of them will say yes.

Having made all of these decisions, my head hurt! The wonderful Andrew Pickles (world’s greatest statistician) then assigned everyone we screened a random number, sorted them, and took a percentage from every possible group (e.g. summer girl, high risk; winter boy, low risk) to ensure the right numbers for the final 600. To further eliminate any testing biases, all of the schools were then randomly assigned to one of six testing blocks such that there would be ~100 children to assess in each block (which corresponds to a 6-week half-term). Within each block we book schools as and when and they invite the children on our behalf.

So there you have it. Once again, other people may have taken a different approach, but this is how we did it. It has been a very rigorous process of debate, weighing up pros and cons, looking up existing evidence and then hoping for the best. And as always, the screening data have raised several new questions and possibilities that we will hopefully be able to follow up in such a rare and wonderful sample. But for now, I must get some sleep as I am in school this week and don’t have time to tell you about the decisions we took in planning the final test battery….

Stage 2 is ready to roll!

Image

Every Friday I collapse in an exhausted heap and think ‘that was surely the busiest week of SCALES yet.’ And then the following week seems even more insanely hectic. Which is part of the reason there has been such a hiatus in the blog – we’ve had an eventful few weeks!

The screening phase of SCALES (Stage 1) closed on 23rd July. The school term started today (I know this because today was my daughter’s first day of school). In the intervening six weeks, we have done some preliminary analyses of the screening data to establish the cut points for the screen (I will be telling you a bit more about this over the coming weeks), had a prize draw for our hard working teachers, randomly selected the main cohort of 500+ children, printed 1000 parent information sheets and consent forms, decided the test battery, ordered equipment, record forms and thousands of stickers, trained the testing team, set up a database and scheduled a year’s worth of school visits. I think we’re just about ready…

I have to admit that I seriously underestimated the logistical challenge that is SCALES. And probably a good thing too – it is mindboggling! Fortunately we have an amazing team. The co-investigators on SCALES are fabulous. Gillian Baird, Tony Charman, Andrew Pickles and Emily Simonoff are fantastically clever and have huge experience of running projects of this size (and never warned me off!). They have really helped us come to important decisions (more about those soon) through pretty intense discussion. Every time I see them I feel like I’m in my DPhil viva again– but the way they make me think is quite exhilarating. I’ve learned so much and have much more confidence in the decisions that we’ve made because we’ve debated them so thoroughly.

For the day to day running of the project I could not be without Debbie – not only does she make very sharp intellectual contributions to the project, but practically she makes everything run incredibly smoothly. I wake up at 3am worrying that we still have X to do, only to find out in the morning that Debbie has already done it! And with style too – all of the children we assess will receive beautiful certificates AND personalised stationery thanks to the wonderful Debbie.

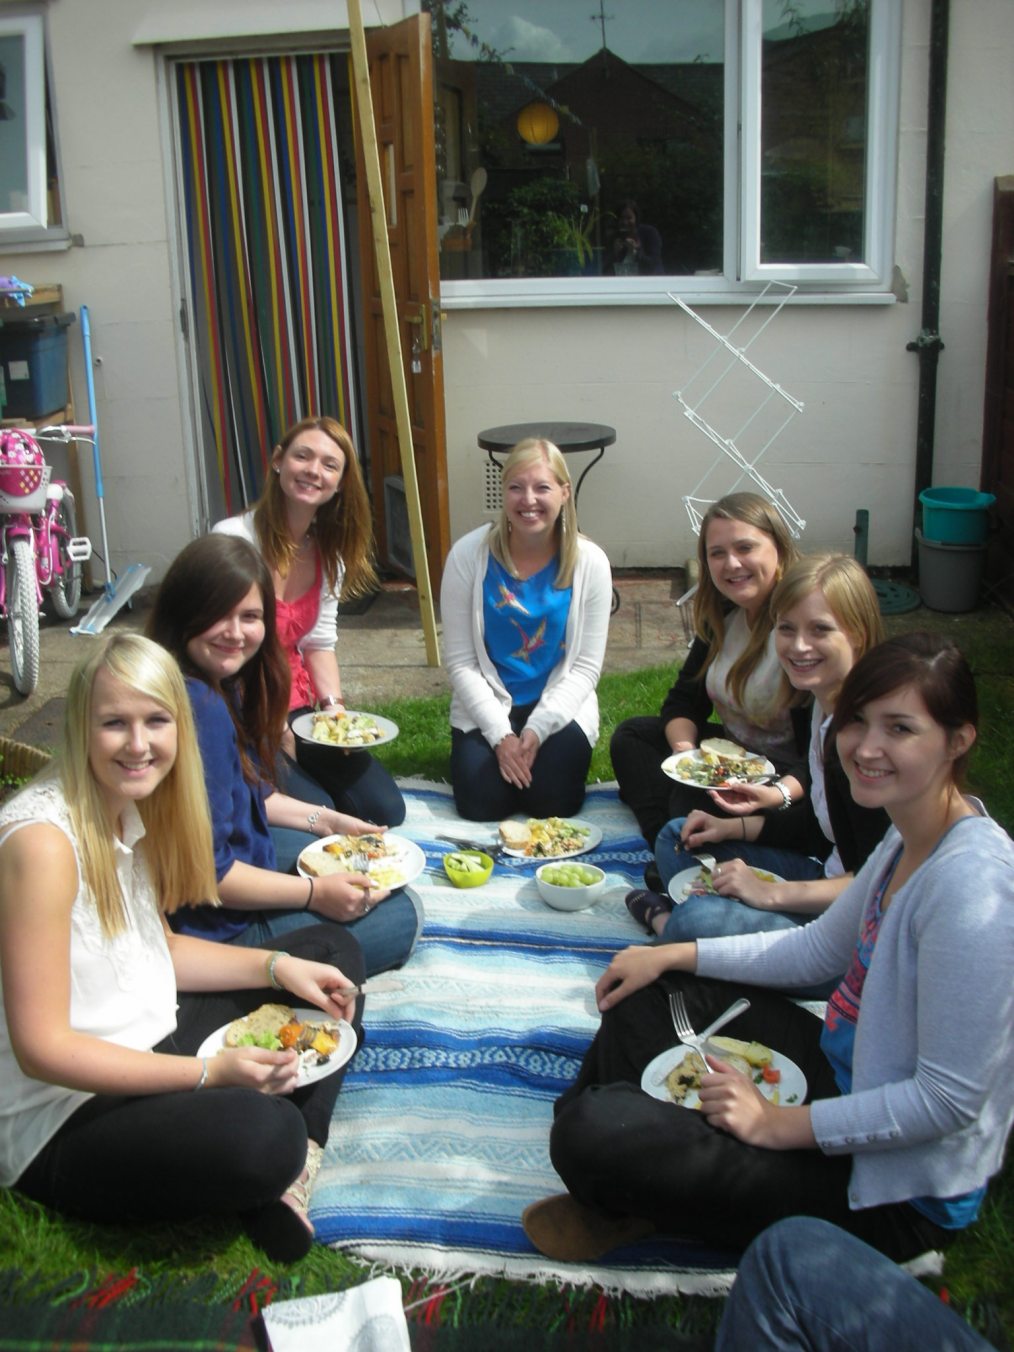
We’ve also managed to land a great testing team (and as you can see from the photo, all beautiful as well as brainy). Finding the right people to go into schools is a real source of anxiety – you want people who are bright, professional, can follow the procedures carefully and record/score/enter data accurately but most importantly, they have to be able to engage with young children. And sensitively manage children who may not always be so easy to work with. Debbie and I put them through their paces during the training week and they were all complete stars. It has been a really steep learning curve – there are 27 activities in the final test battery – so learning each task and being able to move fluidly between them is a big challenge in itself. But to get through the battery and still be smiling is pretty heroic.

The only way to make SCALES more challenging is to try and run the project from an Olympic Village, which is what we did this summer. My University played host to all of the rowers and canoeists in both the Olympics and Paralympics and while this may sound super cool, it was a bit of a headache! Basically, since the beginning of July the campus has been in security lock-down. The entrance to the village was right outside of the psychology building and heavily guarded by people with machine guns (seriously! Even in England). There was only one way in the building and we had to park on the opposite side of campus (about a 15 minute walk – much longer if you are carrying large amounts of testing kit with you). We were not allowed to take any deliveries – even the milk delivery was cancelled! And if you saw the enormous list of gear we needed to order, you would understand the frustration. I had a couple of conversations along the following lines:

Me:  We need to order 8 copies of (insert standardised test of language or cognition here) for the SCALES project.

Admin: We can’t get that delivered to the Dept because of security.

Me: Fine, just send it to my home address then.

Publisher: I’m sorry but we are unable to deliver psychometric assessments to a home address. They can only be delivered to a bona fide educational establishment.

Me: seriously?

It also meant that we were unable to hold our training week on campus – instead we rented some space in a very kind school. The week started like a comedy of errors though. Massive accident on the M25 meant I was 20 minutes late (not a shining example to rest of the team). A communication breakdown meant the catered lunch I thought we were having did not materialise, cue mad dash to the shops and providing meals as well as in-depth instruction to the team. The last straw was probably the day before training started when Debbie and I realised we had to get 8 testing kits from the Department to our distant cars, in order to get them to the training venue. Having vowed to leave the Department no later than 6pm, we found ourselves in reception at 6.30 surrounded by testing materials, instruction booklets, laptops and audiometers. We begged the men with guns to let us drive to the front door, or anywhere that didn’t require several trips up the big hill. No chance. In the end, another young man took pity on us (perhaps because I looked like I might cry at any moment) and helped carry our load to the temporary car park.

Well, the Olympic village is now being dismantled and with a bit of wheeling and dealing we’ve managed to acquire all the necessary bits and pieces we need for testing. Letters to schools and families will go out on Tuesday. Schools have been randomly allocated to 6 testing blocks (one for each half term) and 100 children will be invited for each block. We have a large map of Surrey on the wall and each tester has been allocated a geographical region. The first visit will be at some point during the week of 17 September and they will come thick and fast after that. Wish us luck!

My running disorder

Image

Well Stage 1 of SCALES has now closed. With the help of 194 schools and 243 fabulous teachers, we have screening data for 7,674 children or ~70% of all of the children that started school in Surrey last September!

We have a very short period of time to select from this dataset the 500 children we want to assess in detail – school starts on 5th September! Of the 500 children selected for Stage 2 of the study, 200 will be in a ‘low-risk’ group, meaning that on the screening questionnaire, teacher ratings suggest these children are developing as expected and no one is concerned about the child’s language or communication skills. The other 300 will constitute a ‘higher-risk’ group. Some of these children will already have statements of special educational need, and many will be monitored by the school because of language or communication concerns. The rest will have scores on the screening measure that are significantly below the average range – we are interested to know how many of these children actually do have language impairments. To do this, we need to assess all of the children and determine which ones do or do not meet criteria for language impairment.

Now, you might think that as a speech-language therapist and someone who has been researching developmental language disorders for about 15 years, selecting the test battery and making a provisional diagnosis should be the least challenging aspect of this project. On the contrary – this bit is proving to be hugely difficult and thought provoking. Whatever measures we choose now we are stuck with for the next three years. And how we make a research ‘diagnosis’ influences all other findings; prevalence rates, rates of co-morbidity, stability of deficit, etc.

As the current debacle that is DSM-5 clearly illustrates, deciding what is and what is not a ‘disorder’ is not as straightforward as we would like it to be. To give you an idea of why this may be so, I thought I’d talk you through my own disorder – I have a significant running impairment. You may not have heard of Running Impairment (RI) before, but we can think about diagnosing RI in much the same way we need to think about diagnosing language impairment (see for example, the Great SLI Debate).

Deviation from the statistical norm

Measurement of many human skills and attributes is ‘normally distributed’ and can be plotted on a bell shaped curve like this one:

I’m guessing that running speed is a trait that is also normally distributed, so imagine that the X-axis represents running speed in standard units, with 3 representing super fast, and -3 representing super slow. Now, if you asked 100 people to run 100 metres, about 68 would run it within the range indicated by the dark blue area. As the majority of people run within this speed range, this marks the statistical ‘average’. About 27 people would come under the lighter blue areas – half of them would be a little bit faster than average and the other half a little bit slower. That leaves about 5 people who have running speeds at the extremes – Usain Bolt at one end, and me at the other.

Of course, running speed is heavily influenced by age and gender, so I want to compare my running speed to other women of a particular age. But I’m afraid that even using middle-aged women as my comparison group, I’m fairly sure I’d be in the bottom 3%, which is generally regarded as significantly slower than average. So if we define disorder solely on the basis of distance from a statistical average, I am definitely running impaired.

The nice thing about running speed is that it is pretty straightforward to measure and is culturally invariant in that we can measure it exactly the same way in the UK as we would in any other country in the world (as the Olympics is about to demonstrate). Language and communication, on the other hand, are extremely complex and expectations of what is ‘typical’ vary enormously from one cultural to the next. Not all aspects of language are normally distributed either: vocabulary is, but aspects of grammar are not. Some aspects of language and communication are extremely difficult to measure in a standard way. For example, conversational skills involve two people, so how we converse may depend as much on our conversational partner as it does on our own intrinsic abilities. And while we have good normative data on a range of linguistic markers, we are seriously lacking appropriate normative data for many aspects of communication. Can anyone tell me what the average amount of eye-contact is for a 5-year-old girl or boy?

You may also wonder how we decide which point on the bell-shaped curve is suggestive of a problem. Should everyone outside of the dark blue area be considered ‘impaired’? As that would include just under 1/3 of the population, this probably isn’t sensible. But if we only include those at the extremes, we may miss a number of individuals who are really struggling. When it comes to language and communication, these decisions can often be driven by resource implications.

Finally, you may think my running disorder has little to do with intrinsic ‘impairment’ and more to do with slothfulness or lack of appropriate training. Which brings us to…

Biological and environmental influences

These days there is considerable research focus on identifying ‘biological markers’ of developmental disorders. There is a sense in which if some deficit or difference has a biological origin, it is more ‘real’ and that a biological marker will make diagnosis easier and earlier, paving the way for early interventions. However, for many complex disorders, identifying these markers has been rather complicated and their predictive value rather disappointing. One reason for this is that development is influenced by environmental factors as well as biology.

I’m quite certain that my RI has a biological component – if you were to look at me, long distance runner would not be the first thing that came to mind. In fact, a colleague once described me as a ‘giant athletic teddy bear’ which may give you a better idea. I’ve never seen my parents so much as run for a bus, never mind run for fitness or leisure, which may also suggest a biological basis. However, the fact that no one in my family runs also meant that I was never really encouraged to do much running at home. And it was pretty easy to avoid serious fitness challenges at school too in favour of music or academic activities. So like many developmental disorders involving language, my RI has been influenced both by a biological disposition and unfavourable environmental influences.

But could I have overcome this biological vulnerability with sustained environmental input (otherwise known as intervention)?

Response to treatment

It has been suggested that perhaps the best way to diagnosis disorder is to see how the child responds to intervention (sadly something we can’t do this time in SCALES). I’m not really sure how – if the child improves significantly, does that mean the child did or did not actually have a disorder? And what should we provide for children who aren’t going to be ‘cured’ by our interventions?

Anyway, I’m pretty sure that 6 sessions of running intervention as a pre-schooler with the England coach would have done nothing to improve my running speed in the longer term (6 sessions being the average amount of speech-language therapy provided to pre-schoolers reported in Glogowska et al. 2000). Running 3x per week during term times for a whole school year may have gone some way to establishing good running habits, but in my experience, once I stop having regular running support, I just stop running. (3x a week seems to be the typical model for RCTs of language intervention in primary schools).

I have in fact tried to tackle my RI at various points in my life, even to the extent that I managed to run the London Marathon the year I finished my PhD (in a rather respectable 5 hours and 15 minutes). The outcome is usually the same – I greatly improve my stamina and can run longer and longer distances without feeling like my chest will explode, but my speed never increases very much. I’ve come to accept that I am destined to remain a slow runner. I now run every week with Psychology Women’s Running Club. I have no expectation of getting faster, but they just make me feel better about my RI.

So, like many children with language and communication impairments, my disorder is life-long. Although I can make substantial improvements in some aspects of running with sustained intervention, I can’t be ‘cured’ of slow running (though I have learned to be happier with my running speed). When I’m running, I often ponder how we could develop intervention research paradigms for communication disorders that would focus on these outcomes, rather than a continued focus on outcomes solely measured by a move into the ‘normal range’ on some arbitrary assessment…

I suspect there may be some readers who are still unconvinced by my self-diagnosis of RI. Some might say that this isn’t a disorder, only a difference, just a bit of variation in the rich tapestry of human life. After all, we can’t all be wonderful at everything. I do have a lot of sympathy with this view and would not usually identify myself as ‘disordered’, largely because my running impairment has rarely prevented me from doing the things that I want to do. Which brings me to…

Impact of disorder/difference on daily living

I can assure you that being the slowest runner in the school did nothing for my street cred as a child, as evidenced by the audible groans that reverberated around the gym whenever I was assigned to a particular team. (Though this level of social ostracism was probably compounded by ginger hair and a penchant for white knee socks and patent leather shoes). Fortunately I had a few other things going for me and so managed to survive school with some self-esteem intact.

I also grew up in America, which has created a society in which no one needs to run or walk anywhere. In fact, if you want to walk to the shops or a park or a library, it can be pretty difficult to do in many American towns and will almost certainly raise a few eyebrows.  England is more at home to walkers, but with buses, tubes, cars and even shop mobility scooters, my lack of running finesse really doesn’t disadvantage me at all. Might have done though if I’d lived in rural Africa…

There is considerable debate about whether impact should be part of any diagnostic criteria for disorder. If a child scores below some arbitrary cut-off on some measure of language or communication, but the child is succeeding in his or her own environment, or even performing exceptionally well on some other aspect of development, should we label this child as ‘disordered’? Do we want to expend precious resources on children who may be just fine?

No one will invest resources in my RI and that is ok. I’m not suffering now. But it is worth considering whether my RI is a marker for other disorders that really might cause me grief, and be costly to address in future years. For example, being a rubbish runner may put me at greater risk of obesity and heart disease and these things are not good. Similarly, a low score on a particular language test at school entry may not be too disruptive now, but may be a precursor to difficulties with literacy or social understanding in later years. In that case we need to determine whether addressing the earlier vulnerability improves later outcomes in different areas of development. Tricky to show the causal links though…

Back to SCALES

So my immediate concern is selecting an appropriate test battery for the SCALES project. In the first instance, we need to concentrate on standardised measures of language and decide a score that is significantly below the scores of other children of the same age. I hope I’ve convinced you of two things: (1) that this is a tough decision and no doubt other clinicians or researchers would use different tests, different cut-offs and that these may well yield different results. We will be looking at different diagnostic algorithms and how this relates to outcome and impact in the longer term. (2) Even if a child scores in our ‘impaired’ range, this does not necessarily mean the child has a ‘disorder’. There are clearly many other things to take into account and how children change over time will be most informative.

As for my running – you can catch me at Virginia Water Lake on Thursday afternoons at 4.30…

If you are interested in reading more about this, try these papers:

Tomblin, J.B. (2006). A normativist account of language-based learning disability. Learning Disabilities Research and Practice, 21, 8-18.

Norbury, C.F. & Sparks, A. (2012). Difference or disorder? Cultural issues in understanding neurodevelopmental disorders. Developmental Psychology, on-line first.

The first 1000 screens are in!

Apologies for the radio silence, but it’s been a busy few weeks here behind the scenes at SCALES. Debbie and I have now written to, emailed and phoned every school in Surrey (mainstream, special, independent and even home school families). That is about 340 schools. There are a few that haven’t replied definitively, but 70% have signed up (that’s almost 9,000 children)! The screening data are also now coming in thick and fast – this week we passed the 1000 screen mark, proving that Surrey teachers are FABULOUS! Every once in a great while I let myself believe for a moment or two that this might actually work.

On the whole it is working well – many teachers seem to be logging on and completing the screens without a hitch. The database time stamps all of the entries so we also know that the average time to complete a screen is about 5 minutes – exactly what all of our piloting indicated. Obviously some take longer. I suspect these are the screens of children who are having difficulties and the teachers are pondering exactly what these children are doing and how much it is interfering with classroom success. Of course we also have some outliers – unfortunately here we don’t know whether it is a technical problem or whether a teacher has stopped mid-report to answer the phone, grab a cup of tea or run to the loo.

But there have been a few stresses too and these really do cause me upset because I don’t want anyone to have a negative experience. I’m also beginning to realise that the schools must have a very different perception of the research set-up rather than the dull reality of just Debbie and me in our offices trying to field phone calls and email questions as quickly as possible. So I thought I’d try to explain why things have been set up the way they have been, bearing in mind I really had no idea what was involved in trying to do a study like this before we set off (probably a good thing)…

Where we depart from almost every other screening study in the world is that we are asking teachers to complete the screens and this is clearly a very big ask. Bruce Tomblin’s group sent an army of researchers out to assess the children themselves. We didn’t do that for a variety of reasons. One is practical – it would take lots of people and quite a bit of time to screen upwards of 9-12,000 children and that just wasn’t going to happen here. The main reason is far more important though – all studies to date that involve screening for language difficulties have been hampered by high rates of false positives. In other words, children look as though they are having difficulties on the screen, but no one is worried about them and they don’t tend to look impaired on formal testing. We wanted to have a screening procedure that would pick up children who were having language difficulties that were interfering with their everyday experiences. We also wanted to know how language difficulties impacted on classroom success from the earliest stages. The beauty of doing this study in the UK is that there is a universal assessment of scholastic attainment at the end of a child’s first year of school – the Early Years Foundation Stage Profile. My idea was to include the language and communication screen with the EYFSP so that we could see how variation in language and communication related to variation in school success. And my previous research experience suggested that teachers are indeed very good at picking up the kids who are having difficulties, which I hoped would improve the sensitivity and specificity of our instrument.

When we first applied for the grant, I think we madly suggested that we might have paper and pen versions of the screen. Since then, web surveys have become more commonly available and we learned that the EYFSP was also completed on-line, so we opted for a web version of the screen. Even at 5 minutes a screen, this is considerable teacher time, so we are paying for supply cover so that each teacher has a full day to do the screening. Here I would stress to beleaguered teachers that our funding and the time to get all of this up and running was fairly limited. So the system we are using does the job, but it does have some eccentricities.

One thing that is clearly driving teachers crazy is the need to input pupil numbers. This is because data are anonymous to us, but we need some way to link the screens up to the EYFSP at a later date. We have warned everyone about this and suggest they get a list of numbers ready, but of course it would be better if our system could link directly with the databases schools have and use. Goodness knows how this would be accomplished, but is obviously a better option – sorry!

The other thing that is not ideal is that if a teacher exits a screen part way through one child, the data are not saved. I can appreciate that this is a pain – I don’t know why it does it this way but it does. Hence the occasional outlier for completion time.

The final thing that some people have been less than happy about is the inclusion of an extra 17 questions at the end. This has occurred because just as we started the project, the Government announced that it was replacing the existing EYFSP from next year. So our cohort would be the last with the current measure and our study would be hopelessly out of date before it even started! We pestered the DfE until they gave us the preliminary version of the new assessment. We thought long and hard about including it, but in the end thought it would be best to do so and say something about how this might be used to identify children with language difficulties. But obvioiusly not ideal.

We also have had a few minor glitches like teachers copying the wrong website link, or entering numbers in the wrong order or an occasional warning sign that pops up when teachers move quickly to the next screen that makes them worry their efforts are not being saved (don’t worry – they are all there!). In these instances teachers phone or email to get help and are probably surprised if we don’t answer immediately. This I’m recognising is a big problem so all the answerphones and automatic email replies now include my mobile number. Of course the first day we rolled this out Debbie and I were both in a two-hour long Athena Swan meeting! As I’ve said before, I could do the SCALES project full-time and still be extremely busy. But unfortunately academic jobs rarely work like that so I’m trying to cover SCALES and juggle a large number of other things at the same time. But we are working on it and trying to get back to people straight away.

So it is no wonder that I’m not sleeping very well and am generally anxious about collecting the remaining 8000 screens – we are very definitely learning as we go along and hoping that not too many teachers will be hassled! We are keen to help teachers so things run as smoothly as possible.

And on a very positive note, the data we have look miraculously sensible and I think are going to be extremely interesting. For our first 1000 the gender split is 50:50; 11% with English as an additional language; 13% have reported concerns about speech, language or communication; 3% already have a statement for language disorder and 1% have a statement for ASD. Every day when we save the growing database Debbie and I get more excited. And we are extremely grateful to the hard-working teachers of Surrey who are making it happen!

Children with language disorders get a raw deal (again)

Image

You’ve probably heard that the DSM – the manual that guides clinical and research diagnosis – is changing.  And if you know that, it is probably in the context of some major changes in DSM-V to the diagnostic criteria for autism spectrum disorder (ASD) and the introduction of Social Communication Disorder. I’m not going to talk about the changes to ASD here as there has been extensive coverage in the media, on blogs and in prestigious academic publications.

What you probably haven’t heard anything about at all is the proposed changes to Communication Disorders. I personally have seen no discussion of it and yet the proposals are fairly radical. There has been an abolition of the distinction between expressive and receptive language disorder. Originally, there was a proposal to distinguish ‘specific’ language impairment from general language impairments, and to introduce ‘late language emergence’ as a new diagnosis. As I was gearing up to blog about this, everything changed. There are now three disorders proposed: Language disorder (LD), Speech disorder (SD), and Social Communication Disorder (SCD). There are no core criteria for LD, just a list of symptoms that includes spelling, reading decoding and comprehension, vocabulary, grammar, narrative, expository and conversational discourse and other pragmatic language abilities ‘individually or in any combination’. As yet there is no published rationale for this change. Similarly, SD includes articulation, dysfluency (stammering), voice disorders, and cleft lip and palate. As yet there is no published rationale for this change either. SCD seems to be the only one that includes exclusionary criteria – it is defined as problems with narrative, expository and conversational discourse not accounted for by deficits in vocabulary, grammar, non-verbal intelligence or a restricted repertoire of interests and behaviour (I tried to find such individuals for my PhD– it didn’t work). Although there is a published rationale for the introduction of this disorder, as far as I am aware there is no gold standard assessment with which to diagnose it.

I started wondering who was responsible for making these decisions on behalf of me, my profession and the children I work with most frequently. Luckily it is easy to find out. There are 13 people on the DSM-5 working party for neurodevelopmental disorders and their remit includes the most common disorders of childhood: Communication Disorders, ADHD, Specific Learning Disorders (including dyslexia and poor reading comprehension), Motor Disorders, Intellectual Disabilities and of course, ASD. One might reasonably expect that the 13 people on the working party would have a range of expertise that covers these disorders and the co-morbidities amongst them. When I looked at the list of names I recognised most instantly as eminent scholars and clinicians responsible for a large body of research that I greatly admire. But all of it focuses on autism spectrum disorder! Every member of the working party declare some expertise in ASD; seven of them work exclusively on ASD. There is only one speech-language pathologist on the working party – a real shock given that all of the disorders they cover are associated with speech and language difficulties. Yet I can’t help but think that her contribution is somewhat diminished by the fact that she too works exclusively with young children with ASD. In fact, the only person in the working group that has ever published anything on children with language disorders who do NOT have ASD is Gillian Baird, OBE. I’m super proud of the fact that she is one of our SCALES team, but as a consultant paediatrician, I’m sure her expertise is used more broadly within the group.

I shouldn’t be surprised – in 2010 Dorothy Bishop published an article demonstrating that in relation to prevalence and severity estimates, language disorders are woefully lagging behind in research publications and research funding (especially compared to ASD, which punches well above its weight on both counts). There are numerous reasons for this no doubt, but two things come to mind. First, the profession that serves children with language disorders, speech-language therapy, is dominated by women and has historically been less valued (I think) than other professions such as psychiatry and psychology. The second reason is that the nature of the disorder means that very often parents and families are not always in a position to advocate for a better deal (though organisations like Afasic certainly help). I’d like to change both of those things.

So DSM-V: if you need some fabulous SLTs with research and clinical expertise to help you out, here are some recommendations for you. First and foremost, Professor Rhea Paul – she’s probably had direct experience of working with almost all of the populations you cover and literally wrote the book on Language Disorders (from Infancy to Adolescence). She was also on the DSM-IV working party so her absence here is baffling. Or how about Bruce Tomblin? He is responsible for the largest and most influential population study of language disorder to date (watch this space Bruce!) and knows a thing or two about how non-verbal abilities relate to language disorder over time (amongst many other things). The Speech Disorders are many and varied and require highly specialist knowledge for diagnosis and treatment, which I don’t have, but should be considered. I am amused by all of the press surrounding SCD – you’d think no one had ever thought of it before! Yet there is a substantial literature provided by Martin Fujiki and Bonnie Brinton, Joanne Volden and the UK’s own Catherine Adams, who as far as I’m aware is the only person to have conducted a randomised controlled trial of social communication intervention. I realise this is a very short and Anglo-American specific list, but it is at least a start. And hopefully our European SLTs will be working on the revisions to ICD-10!

The second thing I want to do is increase public awareness of language disorders. If people and policy makers were more aware of language disorders and the impact they can have on social acceptance, well-being, academic attainment and future employment capacity, perhaps we would see more balanced research investment and provision for all children with developmental concerns. To this end, I’m delighted to be a founding member of RALLI (Raising Awareness of Language Learning Impairments), along with Dorothy Bishop, Gina Conti-Ramsden (another SLT!), Maggie Snowling and practicing SLT, Becky Clark. We hooked up with Team Spirit to produce a range of videos that include children and young people, clinicians and researchers living with and working with language disorders. In the first week of release we’ve had over 4000 views from all over the world!

So while I’m not too optimistic about DSM-V, I am optimistic that these initiatives, in addition to the SCALES project, will bring a better deal for children with Language Disorders. Watch the videos here, then spread the word!

The week in numbers

Image

Last week a series of events brought home to me the enormity of the SCALES project. Luckily, I’ve had some help to get through it all. Here are a few examples, in numbers:

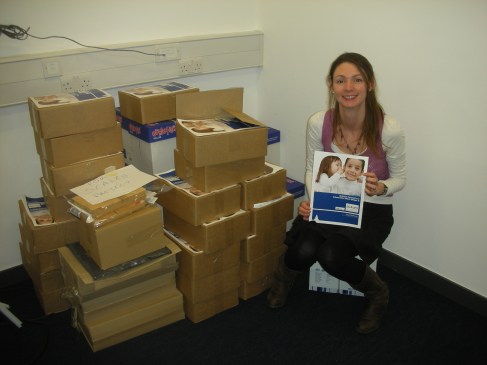
10,000: the number of parent information leaflets delivered in 25 boxes. The RHUL Communications team has done a fantastic job and they look great, but Debbie and I realise it is going to take rather a long time to divide 10,000 leaflets into school packets.

144: the number of schools currently enrolled in the project, just over 50% of all schools with reception classes in Surrey (and more than 6,000 children). We are aiming for 80% so have a way to go, but this week we are concentrating on getting the packets together. That means 144+ envelopes, labels, invoices, return envelopes, and screening instructions. We persuade some undergraduate and PhD students to come and help us in exchange for chocolate and wine. With these supplies and cheesy music in the background, we have a very pleasant Friday afternoon counting leaflets and stuffing envelopes. One small room of the lab has now been taken over by school packs ready for posting and the remaining boxes of leaflets.

219: the number of applications we had for our 12 month graduate research assistant post. Once again, I seriously underestimated the scale of SCALES! We want to interview this week and needed to give a week’s notice to the candidates. I had expected about 70 applications and Debbie and I had blocked out Thursday morning to read through them and come up with a shortlist. What actually happened was that after a few minutes of shock and horror passed as seven batches of applications arrived, we both spent all day reading applications, stopping only for lunch and tea. We missed running club. I got home at 7.30 and started applications again after I put the baby to bed at 8. I finally stopped at midnight after falling asleep in front of the computer for the second time. I was up at 5.30 because we had a staff meeting all morning on Friday and I had to have my shortlist ready before that meeting started. Debbie too put in a massive effort and by 3pm we had it whittled down to seven. Sadly, not many applicants had read Dorothy Bishop’s useful guide to applying for RA positions making it an extremely challenging task indeed! Instead of elation I think we felt a bit deflated – we are hopeful the right person is in the final seven, but we also know that many bright and talented young people will be disappointed.

8: the number of undergraduate research projects I’ve got left to mark

6: the number of consecutive screens Debbie entered before she found the bug in the programme! The teacher screen is web-based; teachers will be able to log on remotely and fill in a short on-line questionnaire for each child in the class. This has been in development for some time now and we’ve done lots of practicing and proof-reading, getting nice teacher friends to give us feedback, filling out 2 or 3 at a time to make sure transitions between questionnaires worked and to find out exactly how the data were saved. It all seemed to be fine, but then genius Debbie decided to plough through 30, as if she were a participating teacher. I would not have had the patience to do this, but thank goodness she did – after six questionnaires it stopped saving the data in columns and put it all in endless rows! IT have now sorted the problem, but it did increase our anxieties about screening 10,000 children. Our next mission is to get a large number of people to log on at once to ensure the system doesn’t crash…

3: the number of reviewer comments I’ve got to address. Obviously the paper is not about SCALES, but some of the comments are relevant. The sticking point seems to be the fact that, try as we might, the group of children we’ve included with language impairments have lower non-verbal ability scores than their typically developing peers. There are at least two reasons why I think this is the case. One is that it seems unlikely that language will be selectively impaired in the developing brain. In essence this is what we are trying to test in SCALES –children will be selected for concerns about language and communication and then we will assess other aspects of development systematically to see what (if any) other deficits go hand-in-hand with language problems. The other reason is that language is a fantastic problem solving tool. You can hear typical kids use their language to figure out ‘non-verbal’ tasks (i.e. ‘it can’t be that piece, the lines are too thick.’ ‘oh, I need the piece with red on this side’). Children with language impairments are less likely to use language in this way because it is not always helpful to them. Over time then, children with language impairment will not do as well as their peers on non-verbal tasks.

Still, the notion of ‘specific’ language impairment persists and the reviewer wants us to either exclude children with lower non-verbal reasoning scores or ‘control’ for non-verbal ability. This makes no sense: excluding children will result in an unusual group that is less representative of the population as a whole.  And because non-verbal and verbal ability are so intimately linked, ‘controlling’ for non-verbal ability will have the effect of controlling for the variable we are most interested in. This is what I’ve said to the reviewers – hopefully they will listen this time! I am more hopeful that SCALES will provide much needed evidence about the impact of language impairment on non-verbal cognitive development and vice versa.

2: the number of PhD applications we made in connection with SCALES and the number of disappointments we’ve had about those PhD applications. One was not funded, one was funded (ranked 3rd in the Doctoral Training Centre) but the candidate has decided to go elsewhere. Both decisions are bewildering to me. The latter is particularly annoying as the studentships are not transferable, so we lose the money and the project. A quick straw poll suggests that I am not alone – people much more senior and amazing than me have been let down. But the small comfort I get from this is quickly replaced by frustration at the amount of time and energy that goes into supporting these applications. Of course there is so much uncertainty and competition in funding that great candidates will have to apply to multiply places. But few things are more painful to an academic than having to give money back (and this is the second time this has happened to me in the last year). Not to mention the time taken to work on the proposals and the number of potential students I turned away to support this one. There must be a better way – why not link studentships to grants? This would guarantee a motivated supervisor and that the student could work as part of a larger team. Or the CASE model, in which the project is funded and the supervisor advertises the studentship and awards to the most suitable candidate. As it is, I am loathe to put another application into the DTC. So I mope about for a few days and then start thinking about how to fund the projects…

The final number has nothing to do with SCALES, but is relevant to my last post:

44: the number of new Fellows elected to the Royal Society last week. Of which 2 were women.

I wonder if they ever had to stuff 10,000 leaflets into 144 envelopes in one afternoon…

Women in Science

Image

More than 80 years ago Virginia Woolf published an extended essay entitled ‘A Room of One’s Own’ in which she asked ‘where are all the women in history of English literature?’ She concluded that for the most part they were too busy scrubbing floors and caring for children, husbands and others to have the opportunity to contribute. The solution? A room of one’s own and a £500 annual allowance – in other words, time, space and enough money to be free of domestic responsibility.

You may think women have come a long way since 1929, but sometimes I wonder. The last episode of Stephen Fry’s otherwise wonderful series Planet Word was all about the written word and there was not a woman in sight. No women interviewed about the role of literature in our society and no women featured as outstanding contributions to the canon of English literature. Not even Virginia Woolf. If we replace ‘in literature’ with ‘in Science’ the question ‘where are all the women?’ is perhaps even more acute. Only 5% of the Royal Society Fellowship is female and last year, only 12% of ERC senior research grants were awarded to women. Thankfully concerted efforts are being made to improve the situation, but we clearly have a long way to go.

So why am I telling you this and what does it have to do with SCALES? Well last week I was asked to take the lead on our Department’s submission for an Athena Swan award. The Athena Swan charter outlines good employment practices for promoting the careers of women in science. Departments can be recognised for identifying barriers to gender equality and rewarded for taking active steps to remove those barriers. Preparing the submission is no trivial task and so in one sense it is yet another thing for me to juggle in an already packed workload. But as a woman in science, with a young daughter, who would one day like to be a Professor, I am intrinsically interested in improving the situation for women. I do wonder though if my conclusions will differ drastically from Virginia Woolf’s.

Take for instance an interview with Steven Pinker published last year as he was promoting his latest book, The better angels of our nature (which I confess I haven’t read – I don’t have time to read anything that goes on for more than 800 pages). When asked how he managed to produce such a scholarly tome, he replied something along the lines of Well, I took a sabbatical from Harvard and went to my second home in Cape Cod where I wrote 24/7, stopping only to eat and get some exercise. In other words, Steven Pinker has time, money and few tedious domestic chores. Should anyone ask me about my more modest contribution to knowledge (the SCALES project) I shall respond, ‘Well, I wrote it up on Fridays in my tiny loft room at the top of the house, stopping only to collect my daughter from nursery, run to the shops, put the washing out and cook the evening meal.’

Why only Fridays? Believe me when I say I could work on the SCALES project full time and still be an extremely busy woman. But like most academics, research is only one component of my job. Academics usually have at least three roles: research, teaching and administration (things like preparing for Athena Swan). Our university also has a fourth role important for Professorial banding which has to do with external engagement and impact. I hope this covers what I think of as my own ‘other’ category, which is less frequently included in workload models. This includes stuff like ‘good citizenship’ (reviewing other people’s grants, journal editorship), ‘public engagement’ (science open day, this blog), and ‘impact’ (LiLac meetings, talks to schools and parent groups, liaising with policy makers). The time I spend on each of these four roles varies somewhat throughout the year – during term time my week can easily be filled with teaching and student related matters. But in general, I try to block two days a week for research and split the rest of the week across the other three roles. Two days a week to run the SCALES project (and the other research projects that are currently running) – that includes the recruitment, testing, supervision of research staff, analysis, writing and rewriting papers and preparing the next round of grants.

And herein lies the problem – no one can really do first class, high impact, internationally renowned research in two days a week. And because the other roles are usually time specific (a lecture at 11 on Thursday has to be ready by 11 on Thursday), academia runs on the assumption that highly motivated, passionate people will pick up research in their ‘spare’ time, i.e. at evenings and weekends. Most academics I know do this, but it becomes a little bit more challenging when there are young children at home. Sure, the flexibility of when you work is one of the attractions of academia, but frankly I haven’t got the mental or physical energy to start writing papers at 9.00pm after the girl is in bed and the house is in order. And there have been times when I have seriously considered throwing in the towel because I realise I can’t compete with other academics who can and do work 24/7.

So what is the solution? I might have a few more ideas when I finish the Athena Swan process, but a couple of thoughts spring to mind immediately. One is acknowledgement that good research takes time and money. Some funding bodies do this: the ERC pays a contribution to salary so that researchers can ‘buy out’ of teaching and administrative duties. But I’m not sure this will be great for women in the longer term. First, they are hard to get and far fewer women apply in the first place, hence the low percentage of awards to women. Second, I’m not entirely sure it is a good idea to remove our stellar female scientists from undergraduate teaching. If we do that, who will inspire the next generation of young women (or young men)?

So if we continue to ask academics to fulfil multiple roles, perhaps our reward systems could reflect this. The man who does all of his admin so badly that he stops being asked to contribute, who puts the minimal effort into teaching and locks himself away night and day to produce his 4* papers while his partner looks after home and kids does not impress me in the slightest, but this is the profile that continues to be rewarded by systems like the REF, with a heavy focus on publication and specifically publication in top tier journals. Why not look at everybody’s total publication output in relation to other duties? I know lots of women who are lacking 4* outputs, but who do consistently high quality research, win teaching awards, do exceptional outreach and public engagement activities and are great colleagues. To do all of this and continue to pursue ever more publications in ever higher impact journals requires an investment of time that is not open to all women.

 Which brings me to the most radical proposal, ironically inspired by a Tory minister describing the disasters that lie in wait should the fuel tanker strike go ahead. He warned, ‘teachers won’t be able to drive, schools will close and working mums will have to take a day off work to look after their children.’ Working mums? Why not working dads? Why can’t dads take a day off work to look after their children?

So in addition to fantastic women in science initiatives such as Athena Swan, I think we need some Men at Home initiatives. We could convene working groups, led largely by men, to identify the barriers at work that prevent them from achieving equality in the home. We could then identify ways to remove these barriers so that men could reach their full potential as husbands and fathers. Two weeks of paternity leave? Rubbish! Why not shared parental leave that both parents are required to take? Brownie points for staying in the office past 6pm? NO! Ensure that men leave work in time to collect the children from school at least three times a week. Catch up with work on a Saturday? Don’t do it – take the kids to the park, do the shopping, make your hard working partner breakfast in bed. Too many papers are published these days anyway and life is short, so switch the computer off and join the family.

Looking at my own situation, I do have a room of my own (though the scalextric is threatening to take over), I earn more than £500 per annum, though certainly not enough to employ a cook or a cleaner once the nursery fees go out. But I am very lucky to have a partner who does his fair share (probably more) of the housework and childcare (thanks Ray!). If that were the norm, and in fact the expectation, I bet in another 80 years time we won’t need to ask ‘where are all the women?’ They’ll be shining for all to see.